 Français
  English
  Français (Canada)
 Track your whole organization
A global overview page: total CPU, total memory, number of running containers and the top 5 resources by CPU and memory consumption.
Organization-wide overview
Metrics and logs for all your resources, right inside your console.
An organization-level overview with a metrics tab and a centralized logs tab, plus detailed metrics on every resource. Pick your time range, from 1 hour to 30 days, with automatic refresh every 30 seconds. No third-party tool to deploy or secure.
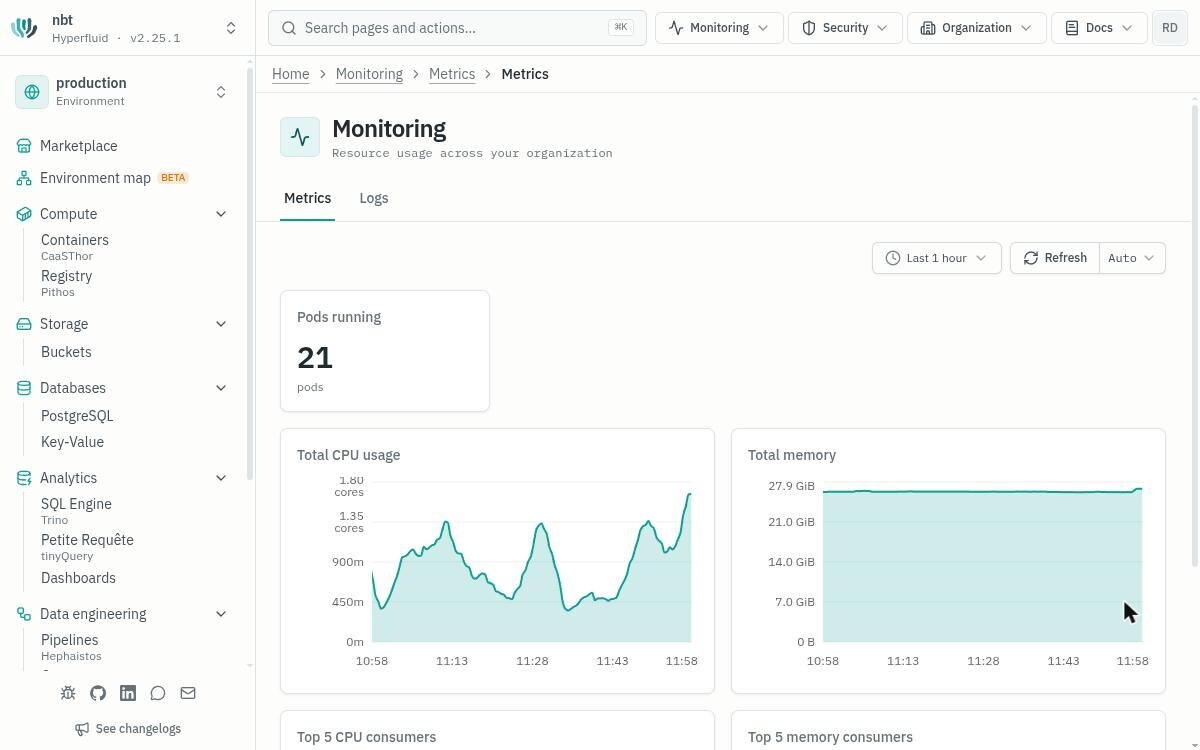
A global overview page: total CPU, total memory, number of running containers and the top 5 resources by CPU and memory consumption.
Organization-wide overview
A metrics tab on every resource, with dashboards tailored to each one: client connections and transactions for PostgreSQL databases, token throughput and p50/p95/p99 latency for model serving, running and queued queries for the SQL engine, broker throughput for Kafka, hit rate and evictions for caches.
Databases, models, apps, Kafka, caches
A Logs tab right next to the metrics: read the logs of your resources, centralized in one place, without deploying or maintaining a log collection stack.
Centralized logs
Usage counters per data product: total API calls, errors and average query duration, broken down by access type (OpenAPI, GraphQL, MCP).
Per-API usage counters
A data team checks the state of a managed PostgreSQL database during a traffic peak
Visibility on the database with no external tool to install
A platform team looks for where the consumption comes from in its organization
The main consumption hotspots are identified without leaving the console
See Hyperfluid built-in monitoring in a live demo.